Trace Explorer
Learn how to use the Trace Explorer to search span data, find distributed traces, and debug performance issues across your entire application stack.
The Traces page is currently in beta. Beta features are still in progress and may have bugs. We recognize the irony.
The Traces page allows you to query individual spans within traces and analyze distributed traces across your entire application stack. When you search by spans, your queries are more targeted and more precise. This helps you pinpoint specific operations that may be causing problems (like slow database queries, API calls, and so on) across multiple traces.
- Trace: A collection of spans representing the end-to-end journey of a request through your system that all share the same trace ID.
- Distributed Trace: A collection of spans representing the end-to-end journey of a request from your frontend to your backend that all share the same trace ID. (In order for this to work, you have to have Sentry SDKs instrumented for both your backend and your frontend.)
- Span: An individual unit of work within a trace, such as a database query or an API call.
To get started, go to the Traces page in Sentry. You'll be able to apply up to three types of span search conditions in the search bar. To see all available search conditions, click on the "all" tab once you start typing in your search. You'll be automatically prompted once you choose your search criteria. You'll also be able to filter by environment and date range.
Each set of search conditions helps you find a specific kind of span within a trace. You can either:
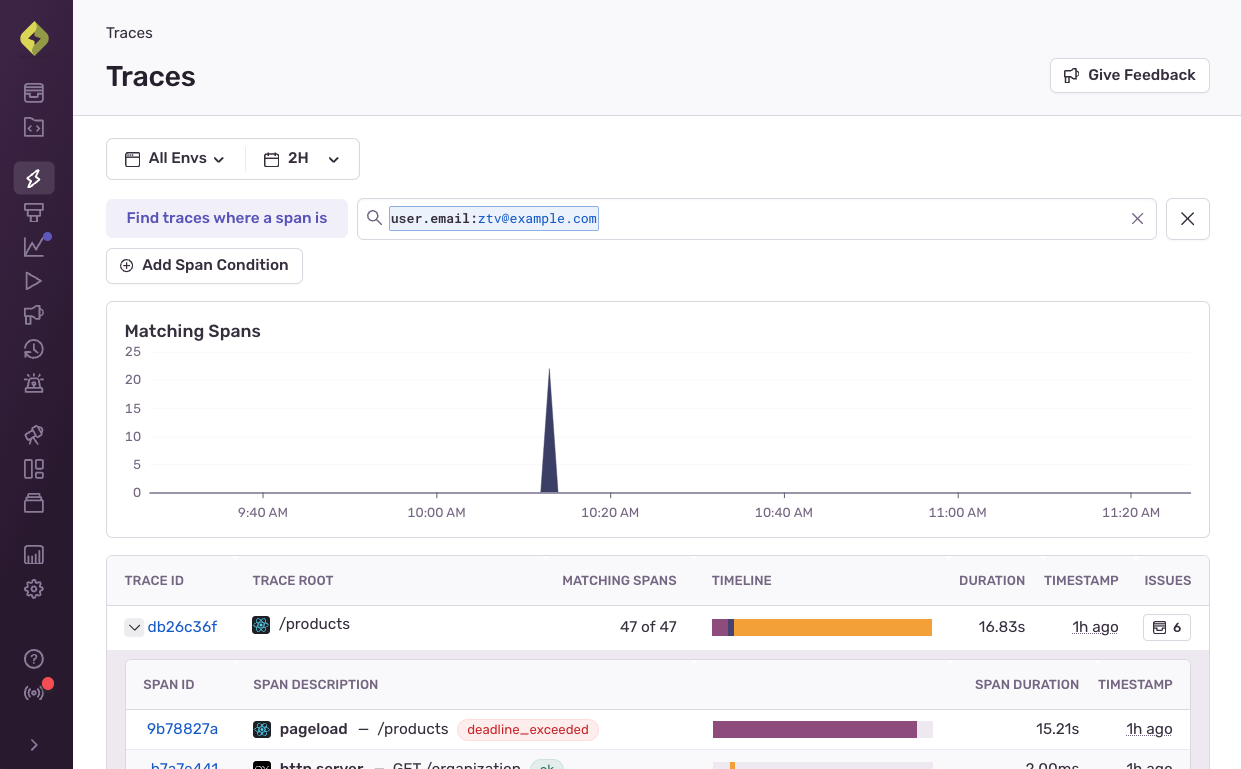
Use a single set of conditions to search across all spans. Example: Single condition: Find traces where a user with email
ztv@example.comloaded a specific frontend route:
Use multiple sets of conditions to search for traces containing all specified span types. Example: Multiple conditions: Find traces where a user with the email
ztv@example.comloaded a page on your frontend on a specific route AND a slow database query was present:
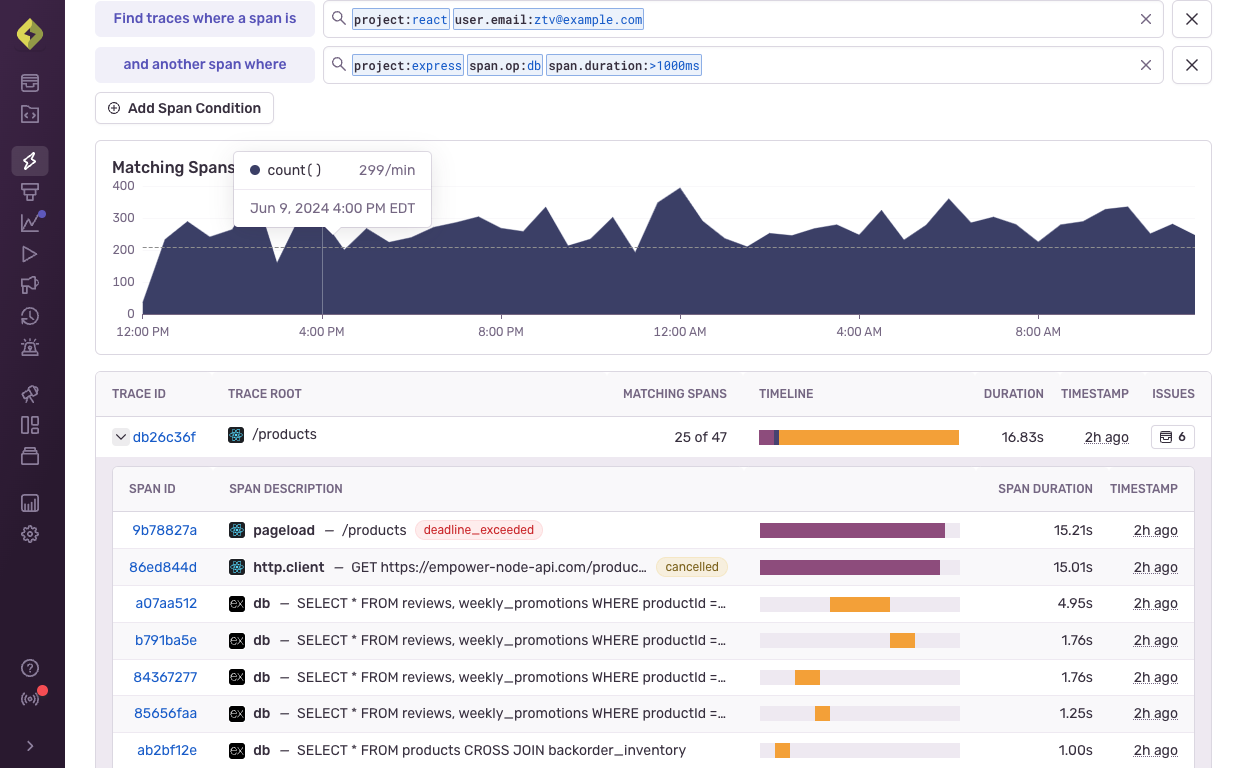
Because traces range accross multiple projects, there's no project filter, but you can filter by projects with similar sets of span conditions by adding project:your-project-here in the search.
The Query Builder uses Sentry's standard search syntax. Here are a few key points to keep in mind:
- Use built-in span properties or custom tags.
- Combine conditions with
ANDandOR(with some limitations on aggregates). - Use functions like
count()for advanced queries.
For a list of built-in key fields used in Sentry, check out our Searchable Properties for Spans documentation.
Trace Explorer uses sampled data. Your search results may be limited based on sampling rates and retention policies. Learn more about retention priorities.
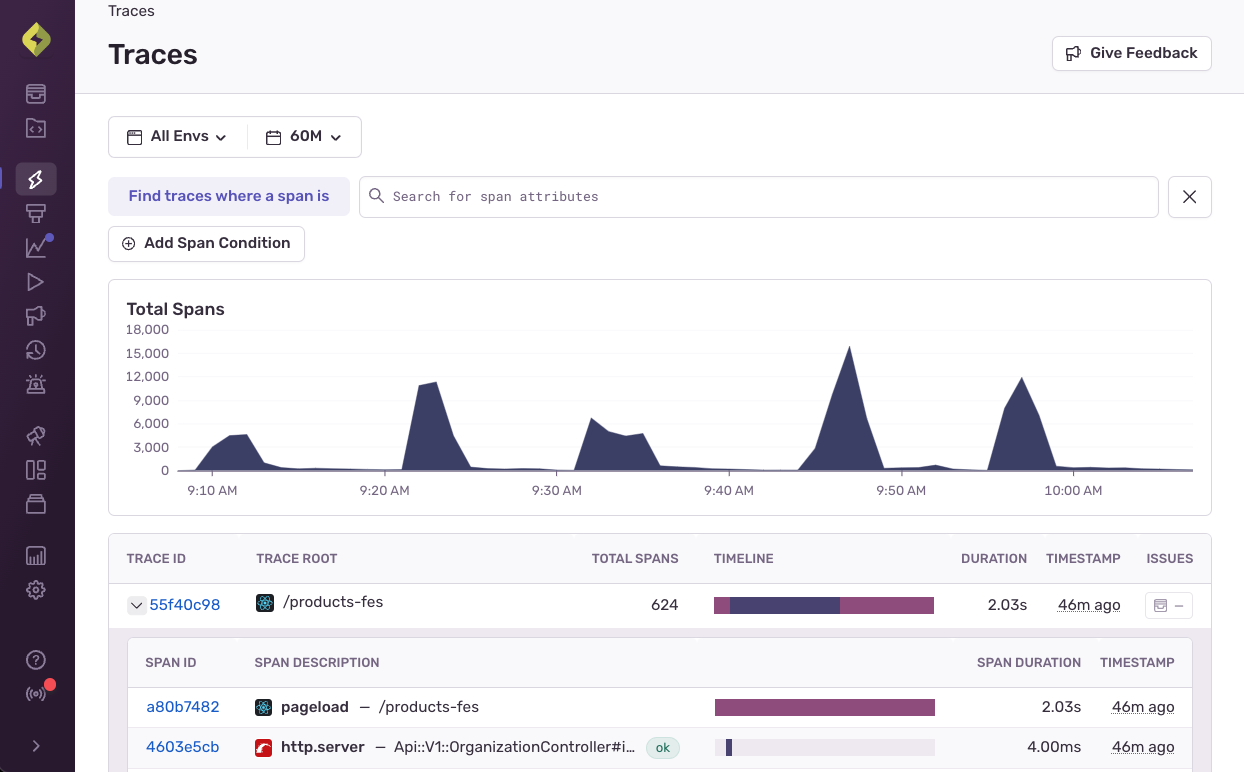
Search results are displayed as a list of traces. Each row corresponds to a single trace and has the below fields:
- Trace ID: Links to the detailed Trace View.
- Project: The associated Sentry project.
- Trace Name: Derived from the root transaction or first transaction.
- Matching Spans: The number of spans matching your query versus the total spans in the trace.
- Timeline: A visual representation of significant spans within the trace.
- Duration: The total time from the first to last span.
- Timestamp: When the trace occurred (hover for exact time).
- Issues: Links to any associated error issues.
Expand a trace to see the matching spans in the following table format:
- Span ID: Links to the span in the Trace View.
- Description: Includes project,
span.op, andspan.description. - Timeline: A visual representation of the span's position within the trace.
- Duration: The time taken by the individual span.
- Timestamp: When the span occurred.
Our documentation is open source and available on GitHub. Your contributions are welcome, whether fixing a typo (drat!) or suggesting an update ("yeah, this would be better").